TL;DR
- Both mortgage rates and consumer demand reflect a strengthening market after a challenging Q4
- Quality inventory remains constrained, with a trend towards more transparent pricing helping properties to move quickly
- Buyers & Sellers continue to benefit from partnering with well-versed, experienced agents who provide insight on navigating a constantly changing market. Side-note: we also expect to see inexperienced agents leave the business this year.
In this newsletter, we observe and analyze trends that emerged from the December, January, and early February residential transaction data to identify potential trends and assess whether or not Q4 was – in fact – the “bottom of the market.”
Where are we today? Let’s dive in

Mortgage rates
Rates for 30-year conforming loans peaked in November 2022: They broke the 6.5% threshold and gradually fell to their current levels of ~5.5%, (This is for jumbo loans – essentially, a loan over ~$1M.) This was particularly painful because interest rates doubled in a matter of a few months last Fall, and – for the first time in YEARS – buyers were hesitating. In this volatile interest rate environment, we’ve advised buyers to consider:
- adjustable rate mortgages (“ARM’s”), and
- partnering with banks that offer (free) rate reductions when you commit to a long-term banking relationship with them…
- And, of course, focus on the long-term picture
And, actually, clients, who are following suit, are snatching rates in the 4’s! We’ve also been reminding buyers that rates will go UP and go DOWN. Historically speaking, the average rates are in the 5-6% range – but the emotional pain of missing out on a 2-3% rate has been very real.
In San Francisco, consumer mortgage demand levels have not materially waned. In fact, competition has re-emerged as buyers enter a more manageable rate environment and are faced with more realistic sellers. As the FED has moderated the pace of rate hikes, lenders are increasingly paying attention to the quality of consumer credit.
As we’ve said before, we expect to continue to see more rate quotes in the high 4’s / low 5’s this year. Of course, some degree of volatility as additional economic data (like unemployment rates) emerge will be expected and is largely dependent on getting inflation under control – feels like every time we take 2 steps forward, we take 1 step backwards.

Inventory
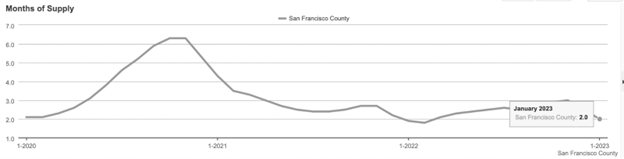
Quality inventory at all price segments remains quite constrained. Sellers that are here are fearful of sitting too long on the market, so we’re seeing more transparently priced properties in order to move them quickly. Sellers are no longer “playing crazy games” – they are (generally) serious / motivated sellers. Inventory has increased from historical lows but remains between 2 – 3 months of supply, a signal that the market has yet to tilt to a true buyers market. (And, most likely, won’t do so. As a reminder: 6 months of inventory defines a buyers market.)
Some buyers who have been on the sidelines for the past few months (due mostly to the rate shock and fear of losing their job) now see the market as more approachable. And, enough time has passed that these “higher rates” are being accepted as the “new normal.” As the FED continues its strategy of inflation tempering, buyer competition will likely steadily increase throughout 2023. Well-versed agents can provide value in their ability to find opportunities amidst the constant change.

Pricing
Many experts believe that Q4 2022 was the bottom of the market – where pricing was more in favor of buyers than it has ever been before – but those prices / opportunities are mostly now gone. We are definitely seeing buying activity pick up in many market segments, more comparable to what we saw in Summer 2022. That said, pricing is a constantly moving target. And, having an expert to help you assess correct pricing on a specific home is worth its weight in gold. In a “normal” environment, when we pull comparable sales (to assess fair market value on a home), we over-index on the more recent sales. That said, this current market is much more comparable to late Spring and Summer 2022.
Ultimately, pricing in the Bay Area is dictated by the level of competition, which is what drove prices throughout 2021. In Q4 2022, bidding wars were not the norm. We’re seeing competition pick back up quickly – just in time for the historically hot Spring market. There are still opportunities to be had, but they are disappearing quickly.
Certainly, the economic outlook and hopes for a soft landing are by no means a foregone conclusion. One thing that is clear, though – 2023 has been a year marked (so far) by cautious optimism in the minds of buyers and sellers. To get ahead in this market, luck will always favor the prepared.
talking points
39%
Proportion of Americans planning to move in the next 3 years, despite current challenges. (Source: Harris Poll)
-25%
Decrease in single-family housing starts from December 2021 to 2022, likely to prolong tight inventory in 2023.
(Source: US Census Bureau)
85%
Homeowners with mortgage rates lower than current levels nationally, contributing to a “lock-in” effect and up to 19% decline in new listings.
(Source: Redfin)
key points
Historical housing start statistics would suggest that home prices will rebound quickly after an initial drop in 2023.

Takeaway: Housing starts is one of the most reliable predictors of the housing market. Movements in home prices stall and reverse course once housing starts to trend in the opposite direction for an extended number of months. The Great Recession of 2007 started ~1 year after the number of housing starts decreased drastically. Despite some pullbacks in housing starts last year, however, homebuilders are expected to resume projects again before the end of 2023, indicating a likely quick rebound in home prices.
If historical lumber prices offer any insights, we may be in for some wild volatilities in home prices in 2023.
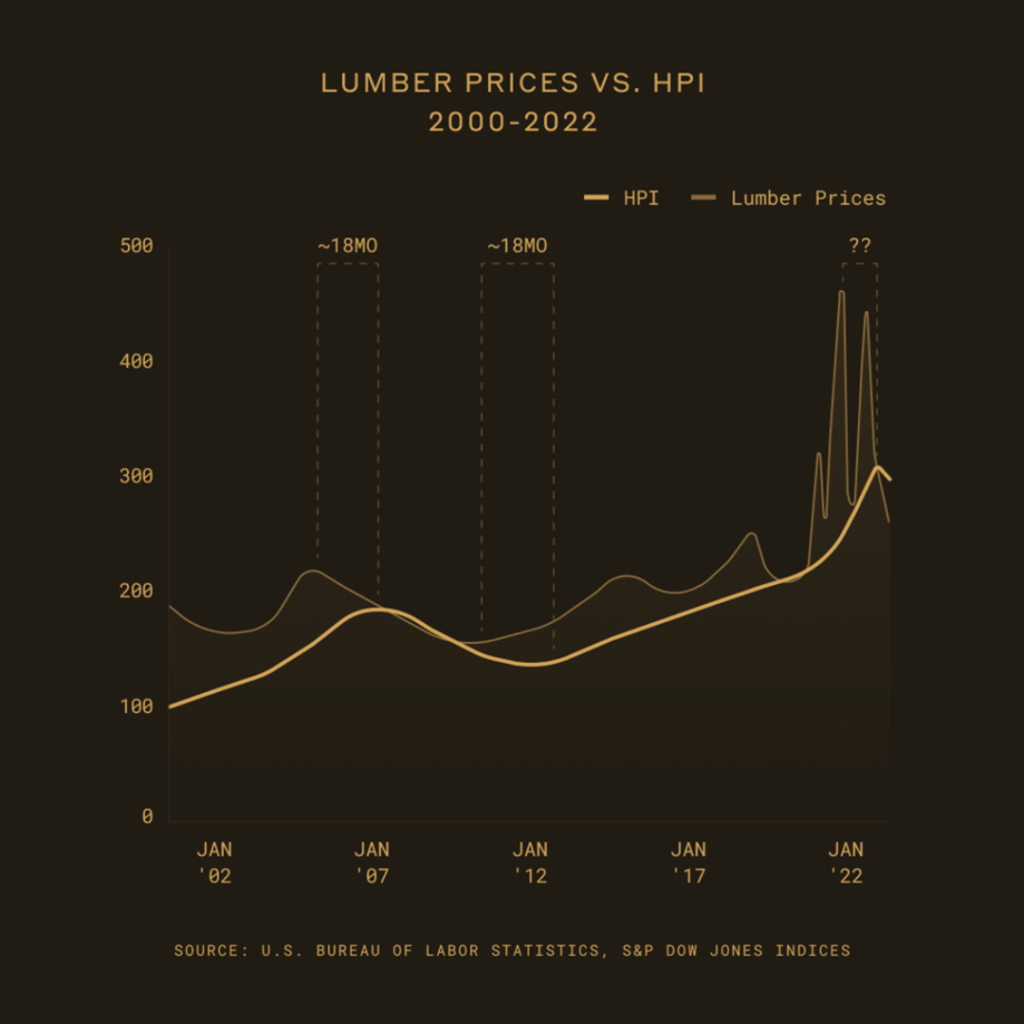
Takeaway: Lumber prices are also generally a good indicator of home prices. Historically, home prices trended in the same direction as lumber prices, ~18 months afterwards. However, given the meteoric increase in lumber prices during the pandemic and fluctuations thereafter, it is difficult to predict how closely home prices will mirror lumber prices this time around.
That’s what we got for now! Thanks for reading. And, as always, don’t hesitate to reach out if you want to chat about what this means for your current situation! We’re always here to empower you with the data.